When building classification systems with demographic fairness considerations, there are two objectives to satisfy:
\[ P(\hat{Y} = 1 | S = s) = P(\hat{Y} = 1 | S = s') \quad \forall s, s' \in \mathcal{S} \]
\[ P(\hat{Y} = 1 | Y = 1, S = s) = P(\hat{Y} = 1 | Y = 1, S = s') \quad \forall s, s' \in \mathcal{S} \]
\[ P(\hat{Y} = 1 | Y = y, S = s) = P(\hat{Y} = 1 | Y = y, S = s') \quad \forall s, s' \in \mathcal{S}, \forall y \in \mathcal{Y} \]
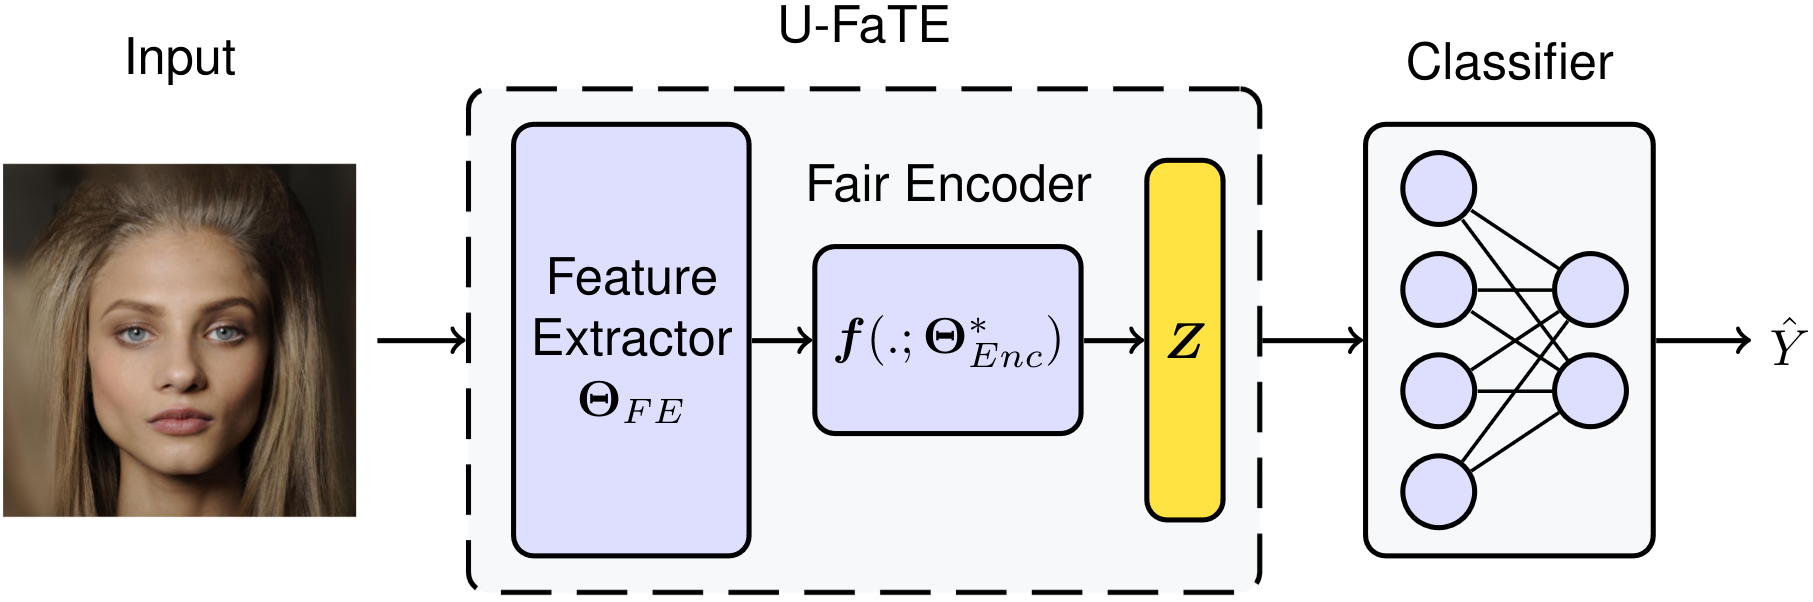
Now, we turn to the second goal of this paper, numerically quantifying the trade-offs from data. The above shows a highlevel overview of U-FaTE to learn a fair representation for a given trade-off parameter \(\lambda\). U-FaTE comprises a feature extractor and a fair encoder. It receives raw data as input and uses a feature extractor to provide features for the fair encoder. The encoder uses the extracted features and employs a closed-form solver to find the optimum function that maps these features to a new feature space that minimizes the dependency on the sensitive attribute while maximizing the dependency on the target attribute. Following this, to predict the target \(Y\) , a classifier is trained with the standard cross-entropy loss for classification problems. This process is repeated for multiple values of \(\lambda\) with \(0 \leq \lambda < 1\) to obtain the full trade-off curves.
The objective function of U-FaTE is defined as follows: \[ \min_{\Theta_{FE}, \Theta_{Enc}} \Big\{ \mathcal{L} = {\color{green}-\ \text{Dep}(f(X; \Theta_{FE}, \Theta_{Enc}), Y)} {\color{red}\ +}\ \frac{\lambda}{(1 - \lambda)} {\color{red}\text{Dep}(f(X; \Theta_{FE}, \Theta_{Enc}), S)}\Big\}, \] where \(\lambda\) is the trade-off parameter, \(f(X; \Theta_{FE}, \Theta_{Enc})\) is the output of the feature extractor and encoder (\(Z\) in the above figure), and \(\text{Dep}(\cdot, \cdot)\) is the dependency measure.
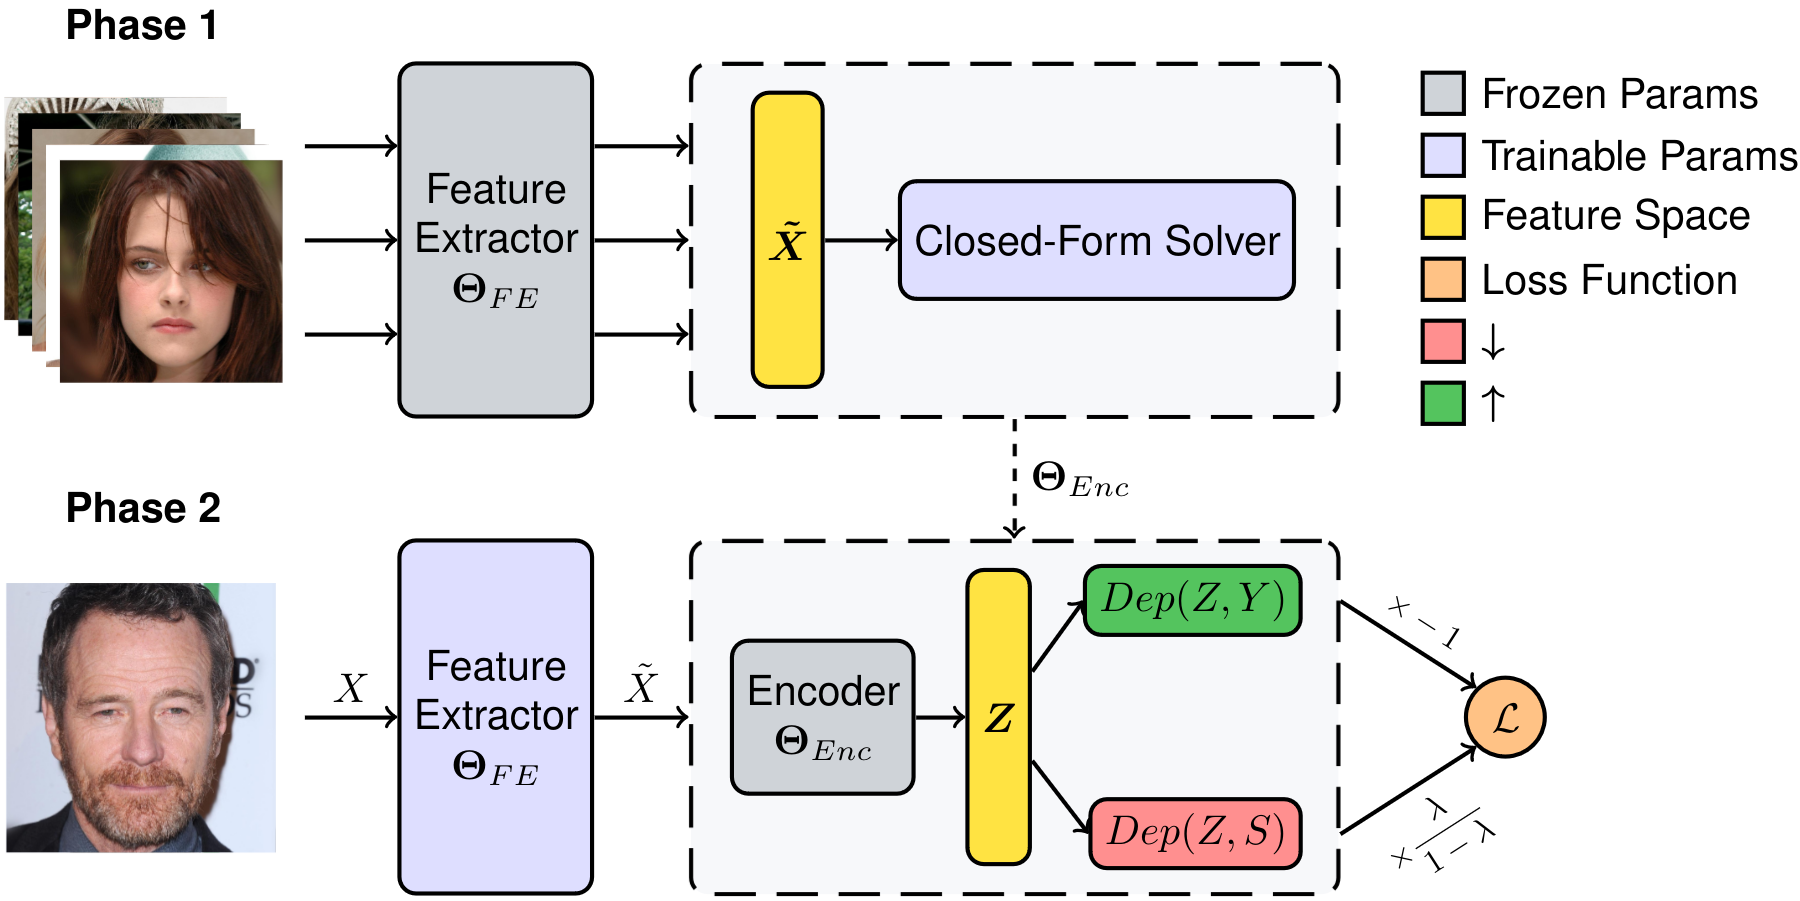
The above figure shows an overview of the training process of U-FaTE which includes two phases. In the first phase, the features of the training samples are extracted and used to find a closed-form solution for the encoder to maximize the previously mentioned objective function while the parameters of the feature extractor (\(\Theta_{FE}\)) are frozen. In the second phase, the feature extractor is trained by updating its parameters using backpropagation in order to minimize \(\mathcal{L}\) while the encoder is frozen. These two phases are repeated until convergence.
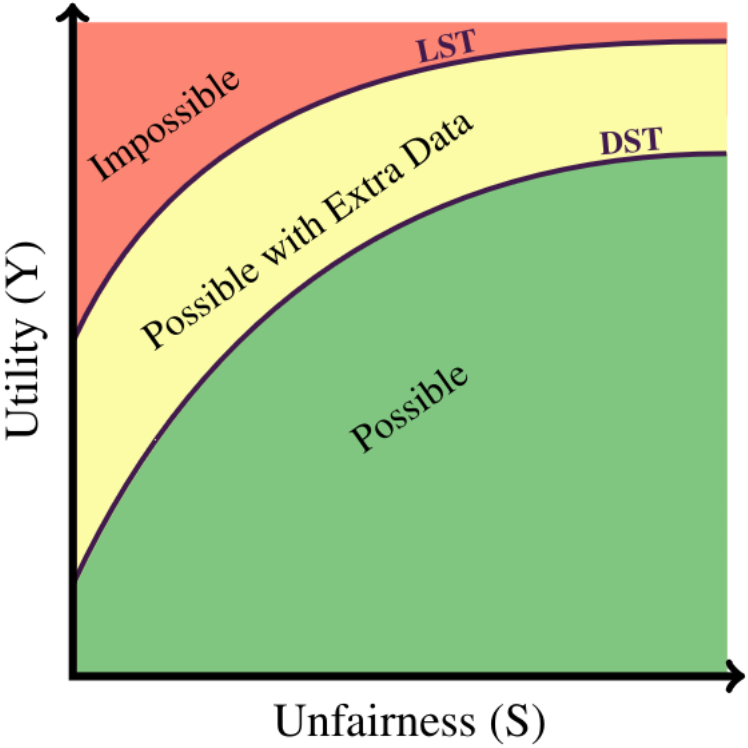
We designed experiments to answer the following:
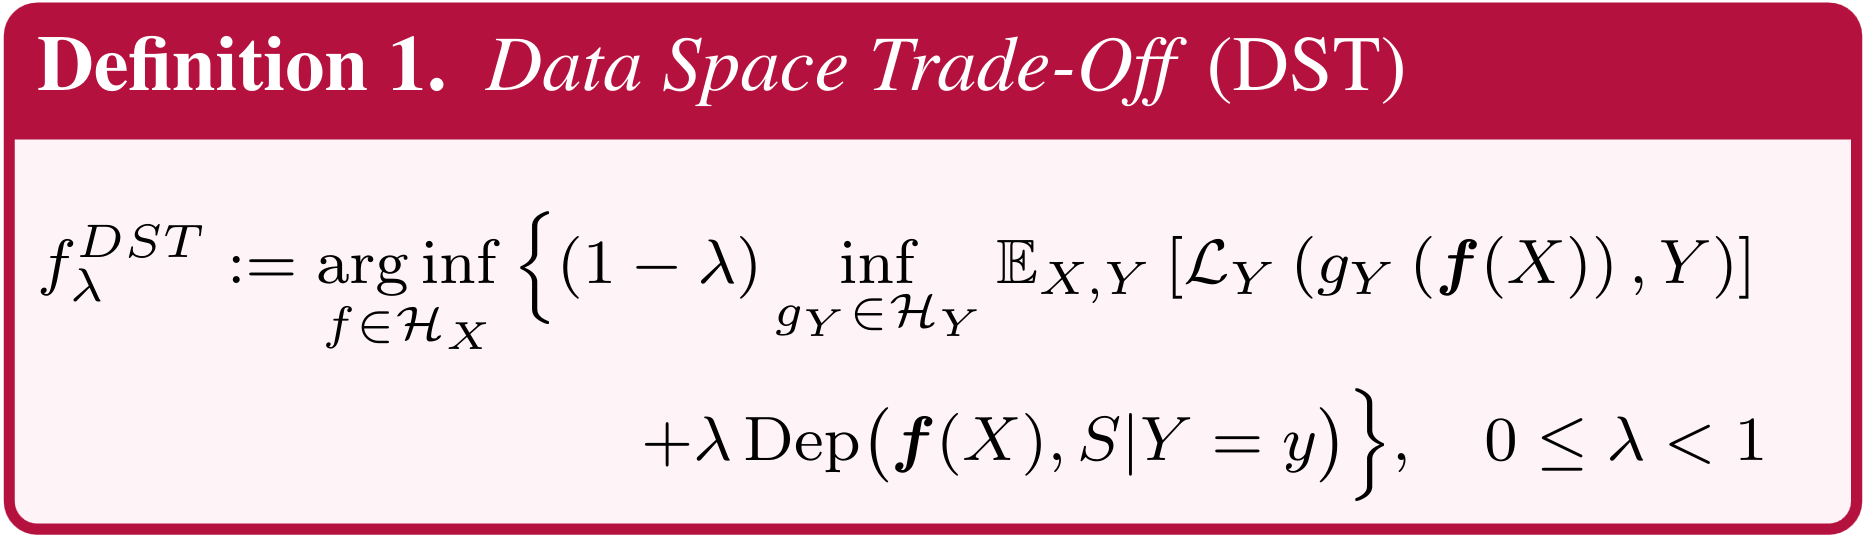
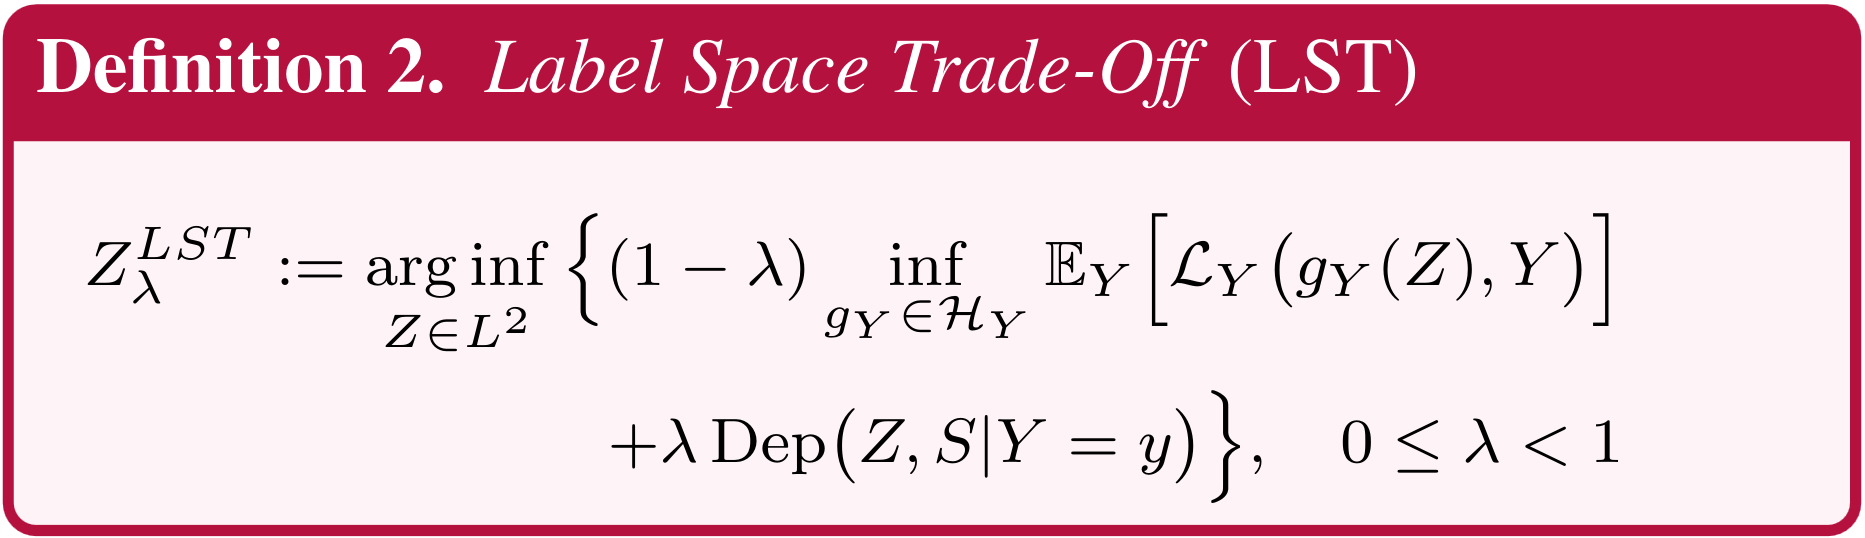
To answer the first question, we estimate the LST and DST through U-FaTE and the trade-offs from the other baselines across various settings and datasets.
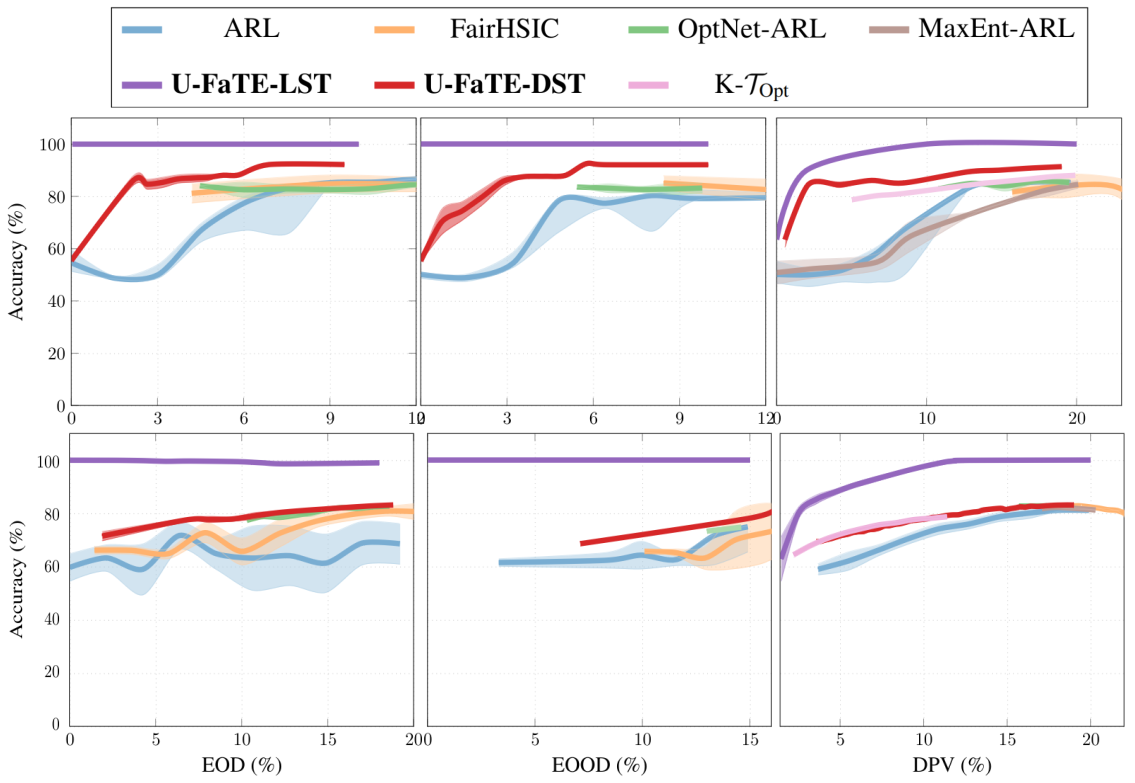
The first row depicts trade-offs on CelebA dataset (\(Y\): high cheekbone, \(S\): age and sex) for EOD, EOOD, and DPV. Similarly, the second row represents trade-offs on Folktable dataset (\(Y\): employment status, \(S\): age).
Observations: While certain methods may approach optimal accuracy in specific cases, they often fail to cover the entire spectrum of fairness values and exhibit stability issues.
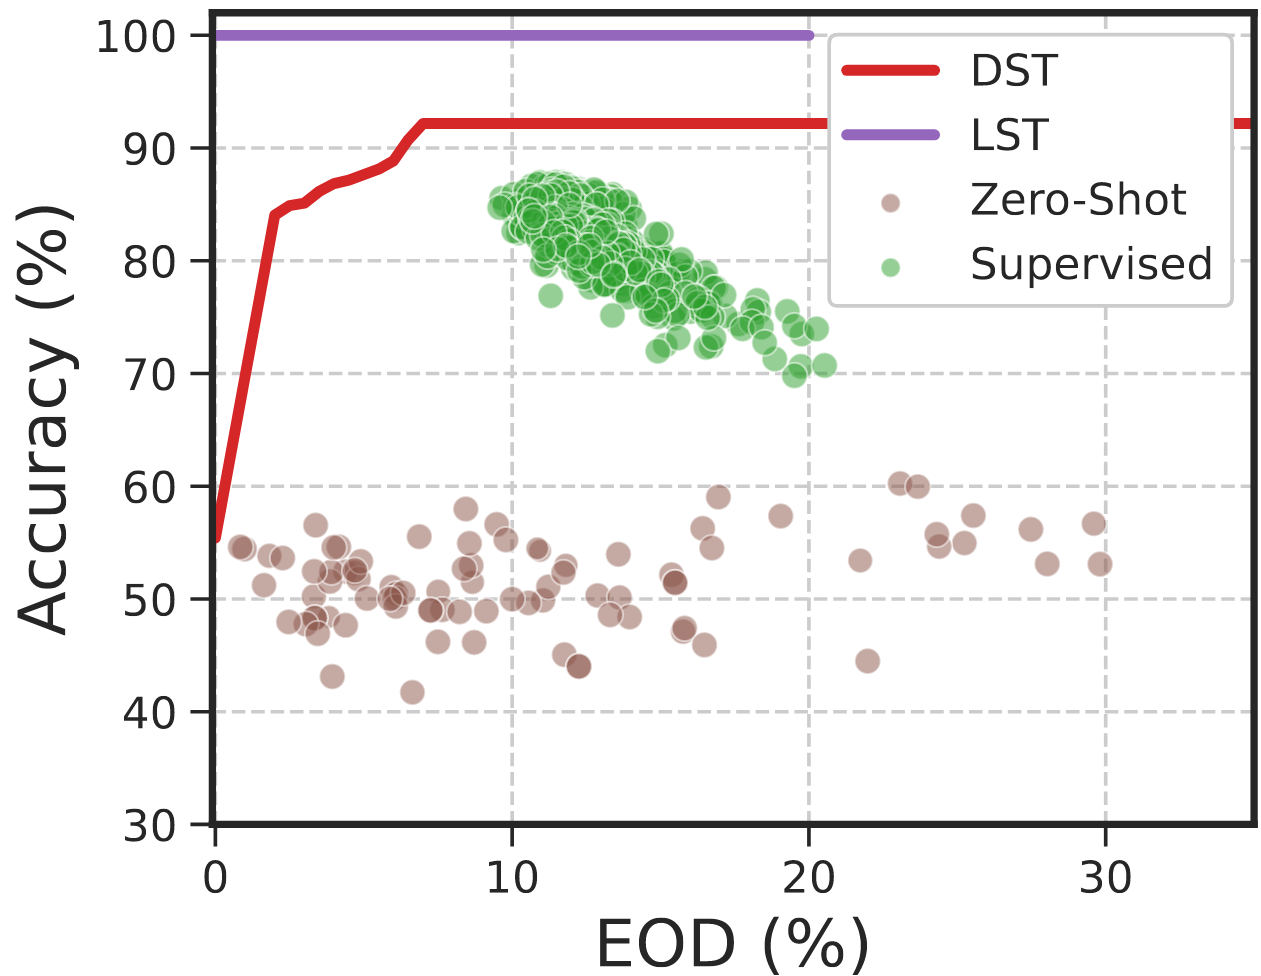
To study the fairness of zero-shot predictions of currently available CLIP models, we consider more than 90 pre-trained models from OpenCLIP and evaluate them on CelebA (\(Y\): high cheekbone and \(S\): age and sex) and FairFace (\(Y\): sex and \(S\): ethnicity) for the same target and sensitive labels as the previous experiment.
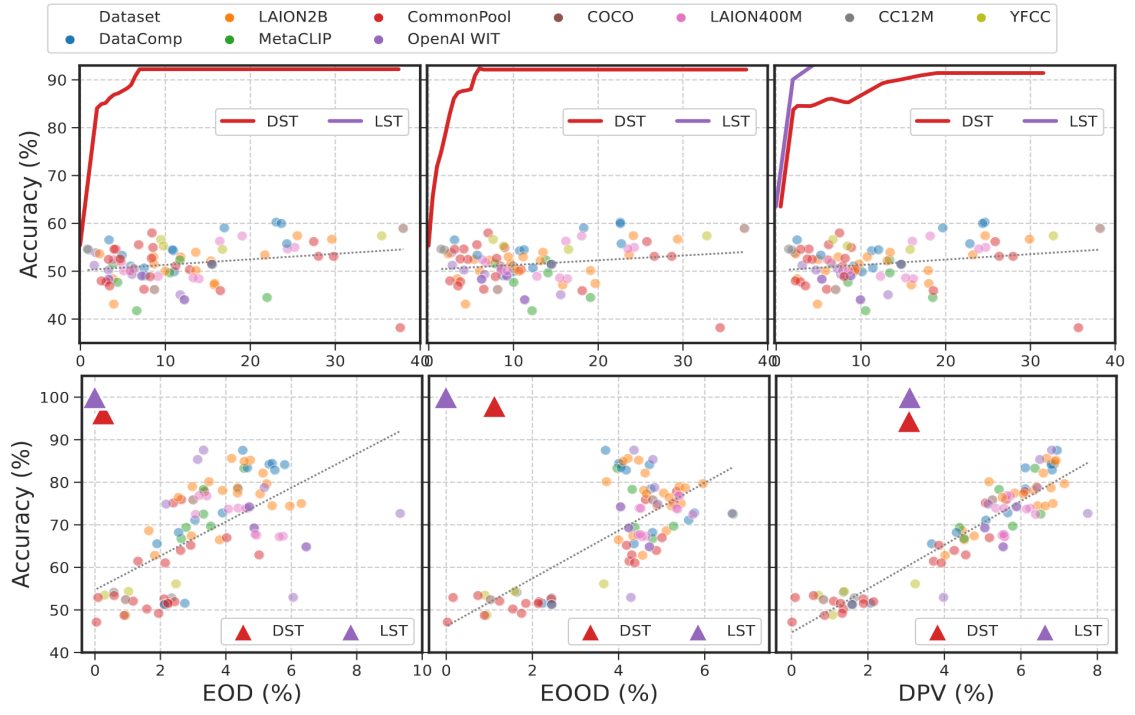
From the results of CelebA (\(1^{\text{st}}\) row of the above figure), we observe that zero-shot models perform poorly on CelebA task accuracy, likely due to rarity of high cheekbones label in their training data.
On FairFace (\(2^{\text{nd}}\) row), we observe that CLIP models demonstrate high accuracy on FairFace due to the abundance of the target task (sex) in pre-training datasets.
Both results suggest that models trained on CommonPool exhibit higher fairness while models trained on DataComp show slightly better accuracy.
To examine the fairness of image representations from supervised pre-trained models, we assess over 900 models from PyTorch Image Models. They are evaluated on CelebA and FairFace using the same target and sensitive labels as previously.
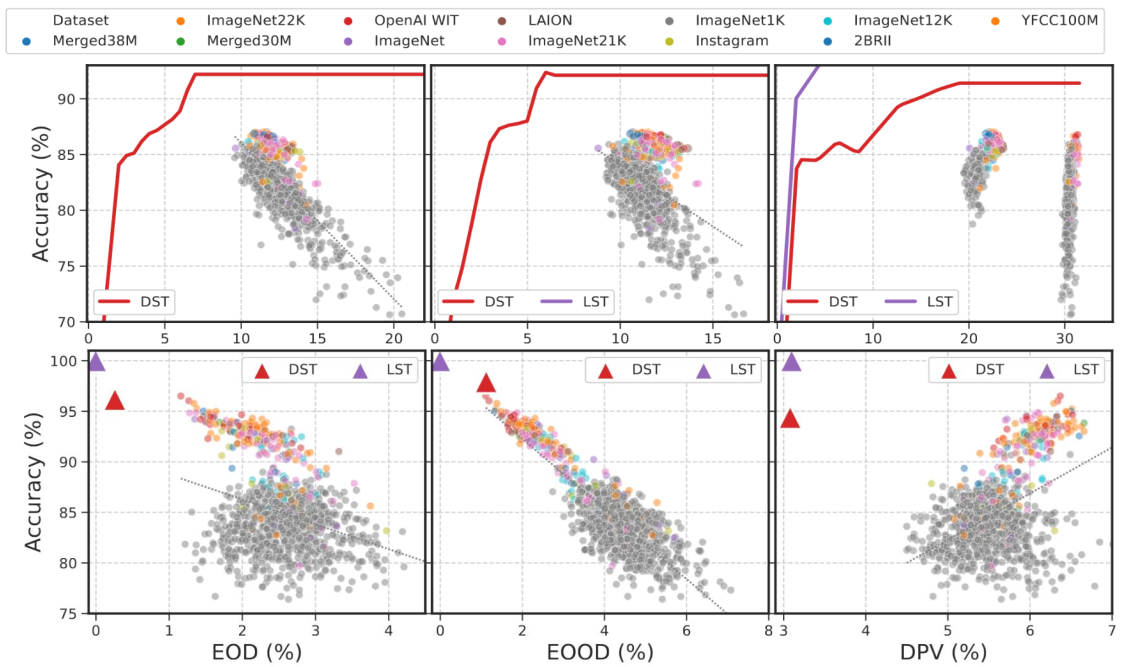
From the CelebA results in the first row, we observe that models pre-trained on ImageNet22K, and OpenAI WIT have the best accuracy. However, with more than 11% EOD and EOOD and more than 20% DPV, they have significant levels of bias between the two sexes.
Results on FairFace (\(2^{\text{nd}}\) row) also reiterate that models trained on OpenAI WIT and ImageNet22K are more fair and more accurate than other datasets. We also observe that the models are generally more fair on FairFace than on CelebA.
 |
S. Dehdashtian, B. Sadeghi, V. Boddeti. Utility-Fairness Trade-Offs and How to Find Them |
@inproceedings{
      dehdashtian2024utility,
      title={Utility-Fairness Trade-Offs and How to Find Them},
      author={Dehdashtian, Sepehr and Sadeghi, Bashir and Boddeti, Vishnu Naresh},
      booktitle={IEEE/CVF Conference on Computer Vision and Pattern Recognition},
      year={2024}
      }