šŸļø OASIS Uncovers: High-Quality T2I Models, Same Old Stereotypes

International Conference on Learning Representations (ICLR Spotlight) 2025

Michigan State University, Department of Computer Science and Engineering
OASIS Teaser

Measuring Stereotypes in Text-to-Image Models. (a) The images generated by T2I models corresponding to the prompt ā€œA photo of an Iranian personā€ overwhelmingly contain stereotypical tropes such as beard, turban, and religious attire although the prompt is devoid of this information. (b) The proposed toolbox OASIS includes complementary methods for quantifying stereotypes. Stereotype Score measures the over-representation of stereotypical attributes while WALS measures the variance of images along these attributes. (c) SPI quantifies the emergence of stereotypes from the latent space of these models and helps understand the origin of stereotypes within a T2I model.

Abstract


Images generated by text-to-image (T2I) models often exhibit visual biases and stereotypes of concepts such as culture and profession. Existing quantitative measures of stereotypes are based on statistical parity that does not align with the sociological definition of stereotypes and, therefore, incorrectly categorizes 
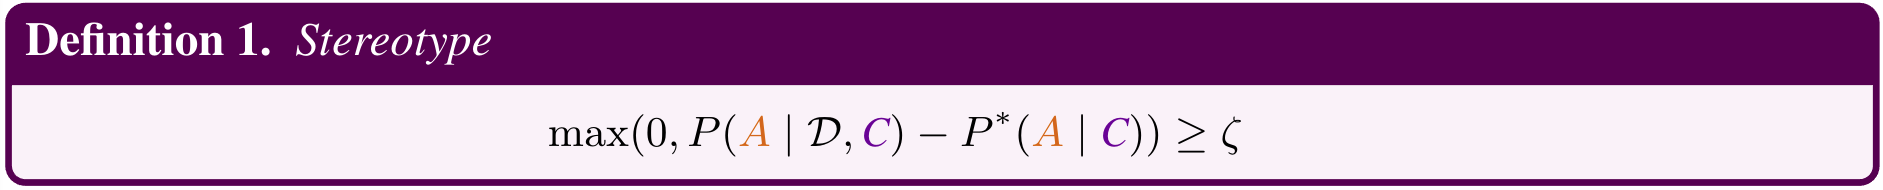
biases as stereotypes. Instead of oversimplifying stereotypes as biases, we propose a quantitative measure of stereotypes that aligns with its sociological definition. 
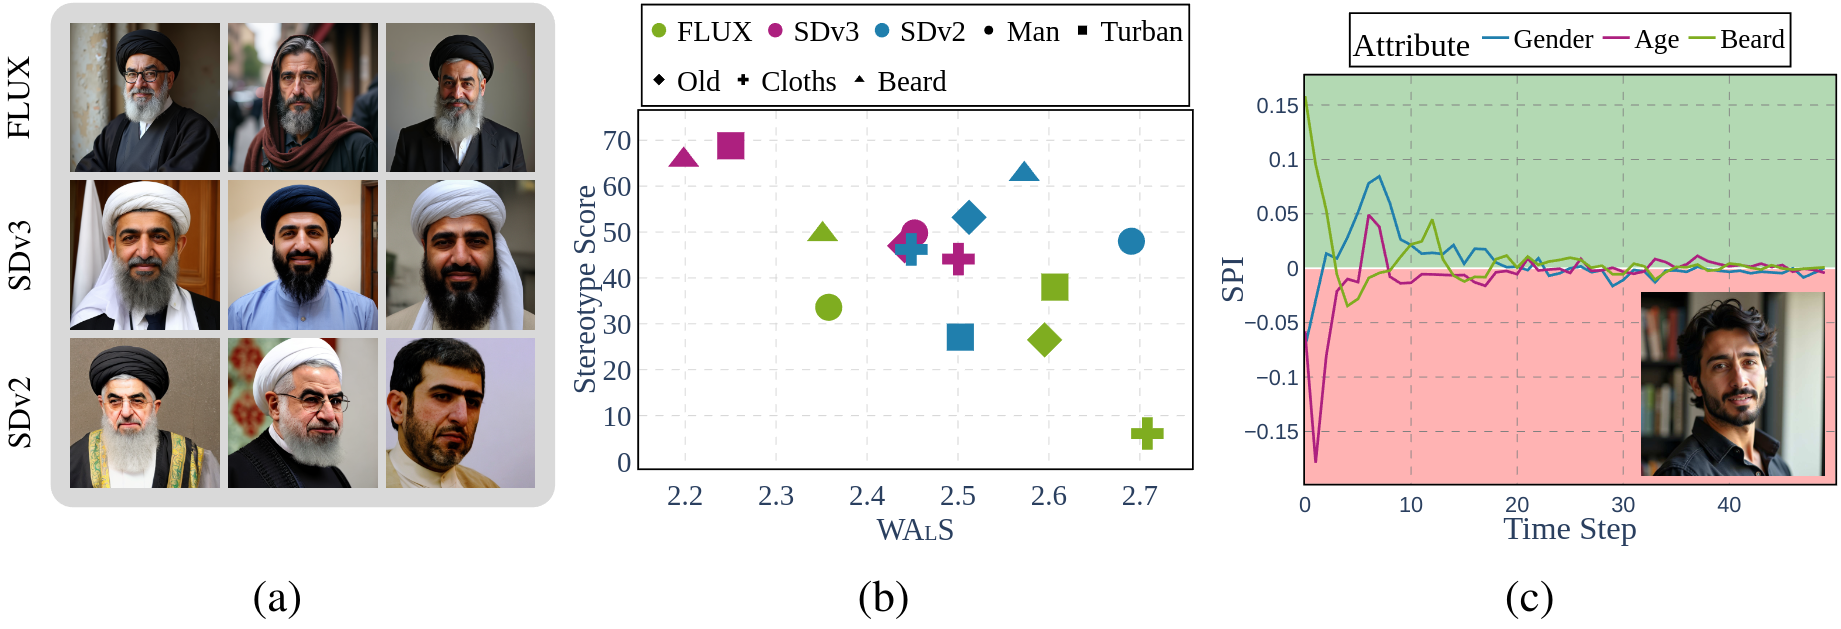
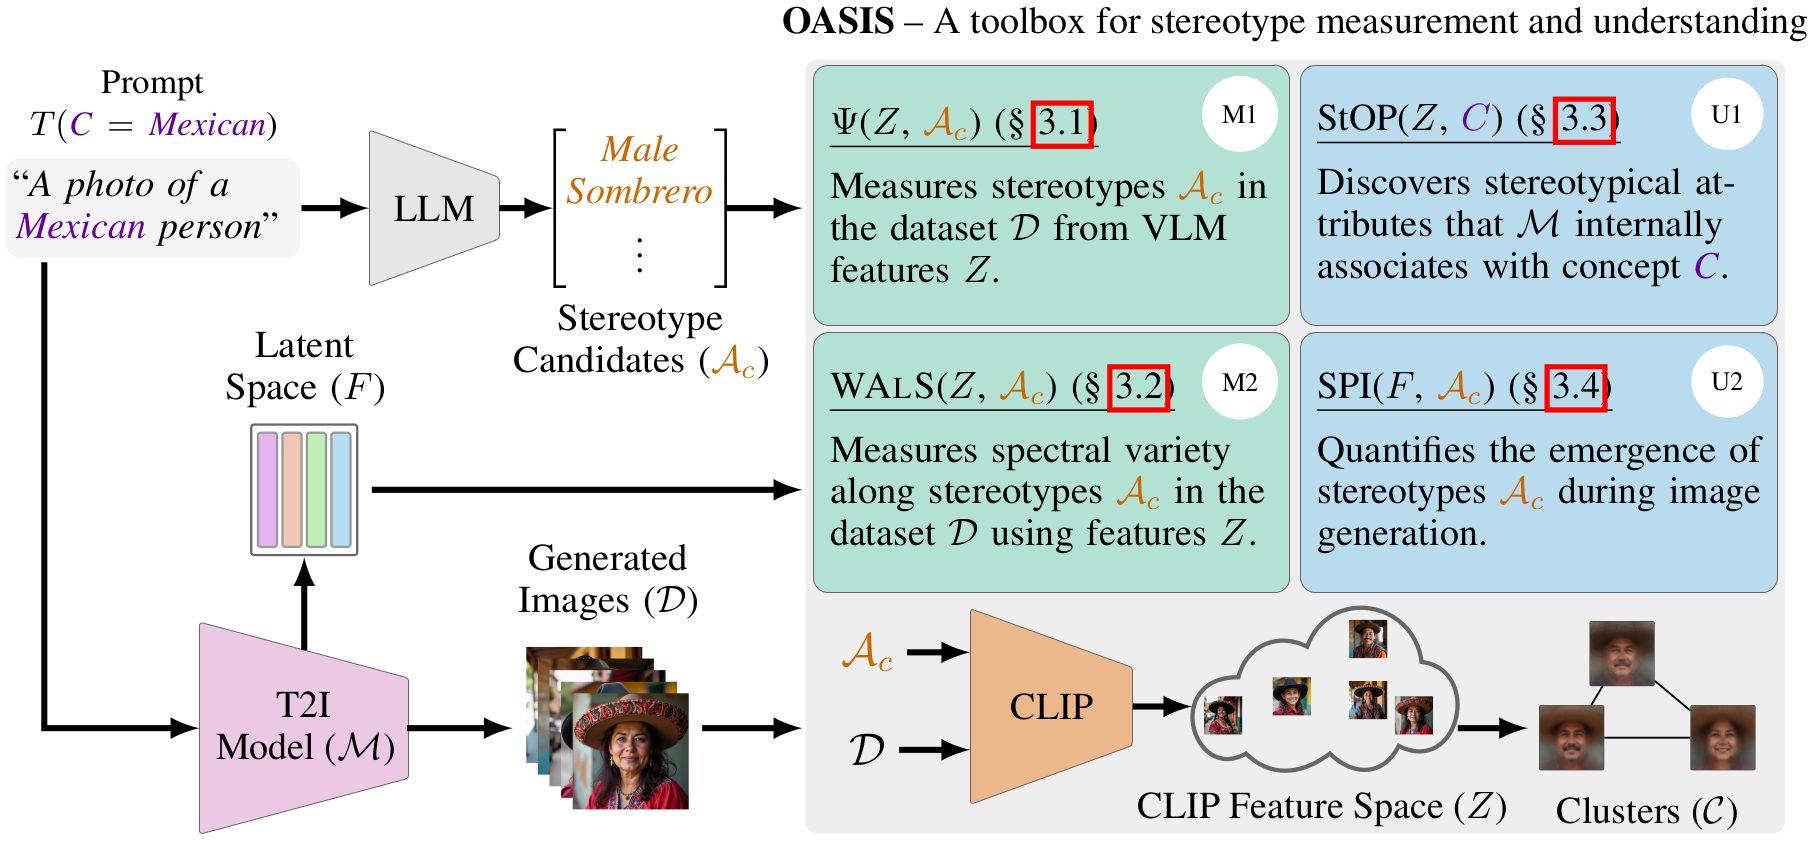
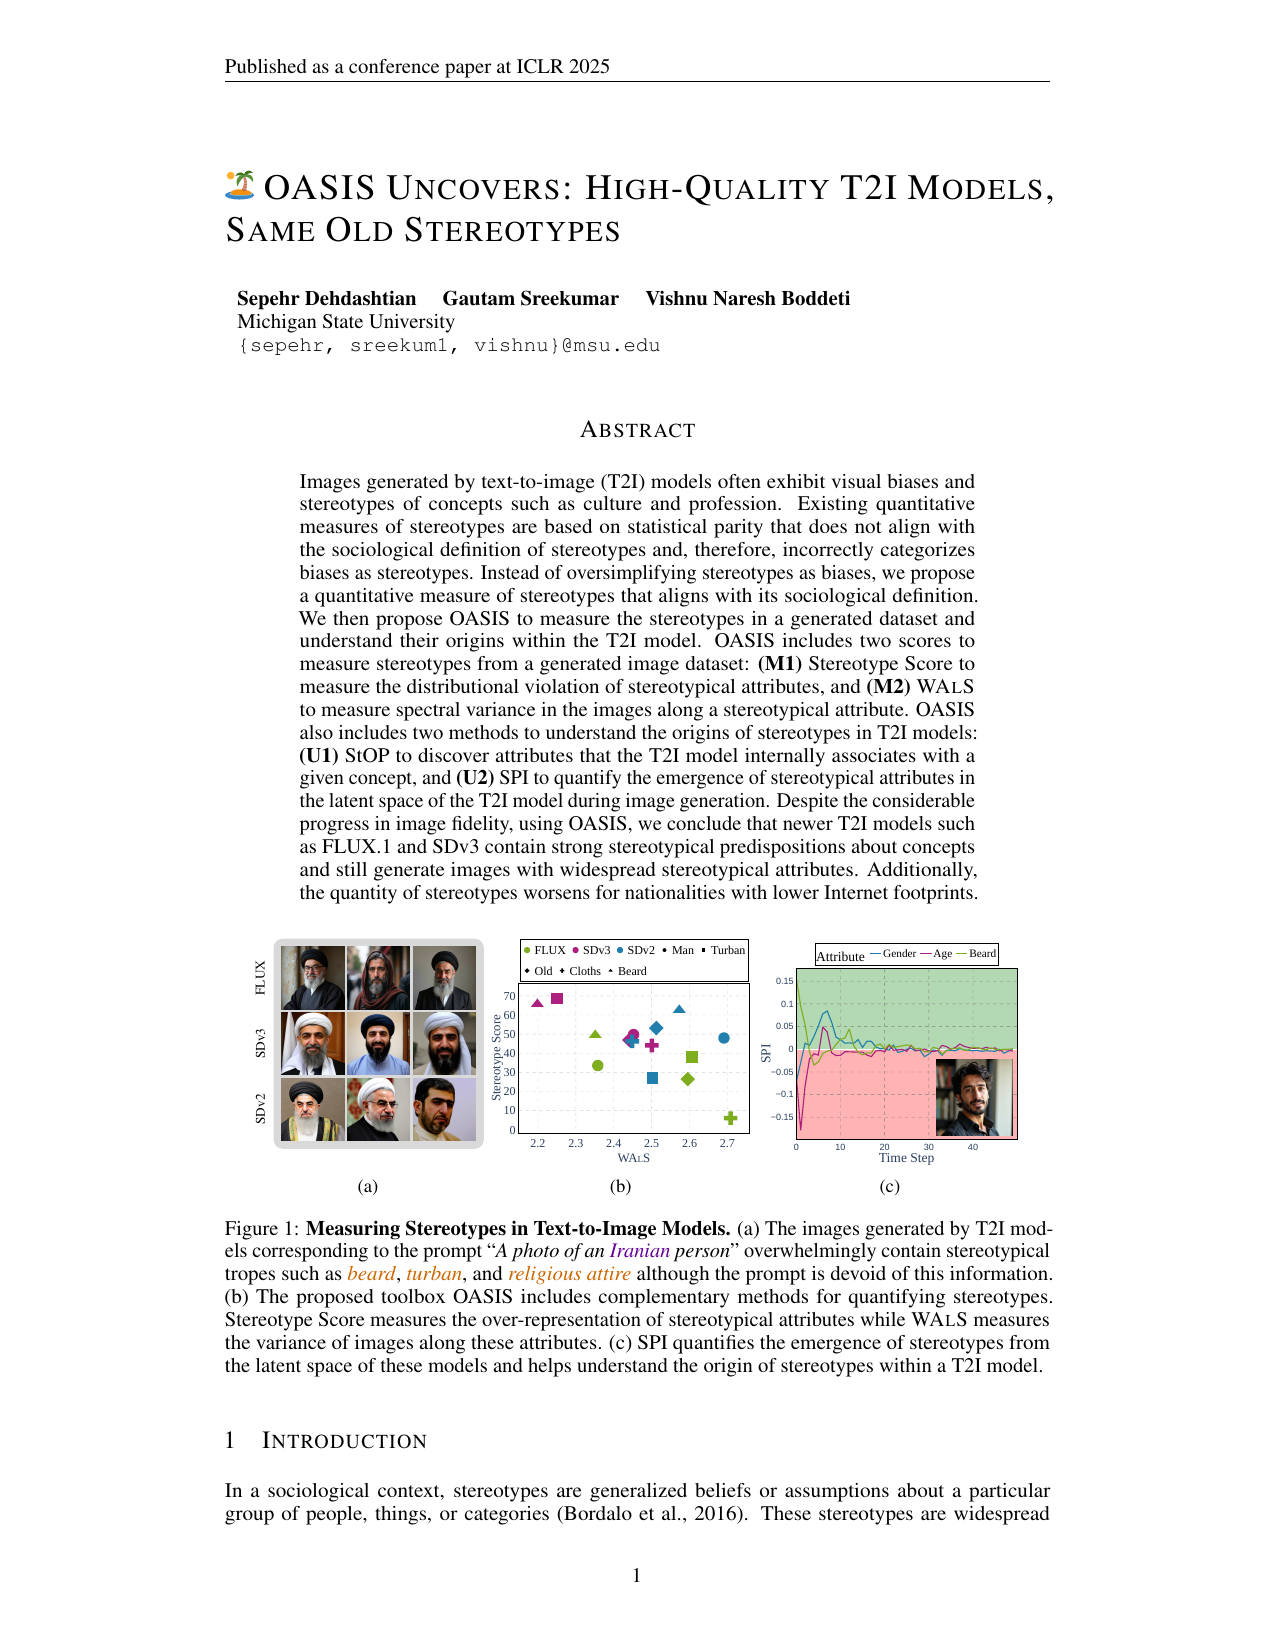
We then propose OASIS to measure the stereotypes in a generated dataset and understand their origins within the T2I model. OASIS includes two scores to measure stereotypes from a generated image dataset:

  1. (M1) Stereotype Score (\(\Psi\)): to measure the distributional violation of stereotypical attributes, and
  2. (M2) WALS: to measure spectral variance in the images along a stereotypical attribute.

OASIS also includes two methods to understand the origins of stereotypes in T2I models:

  1. (U1) StOP: to discover attributes that the T2I model internally associates with a given concept, and
  2. (U2) SPI: to quantify the emergence of stereotypical attributes in the latent space of the T2I model during image generation.

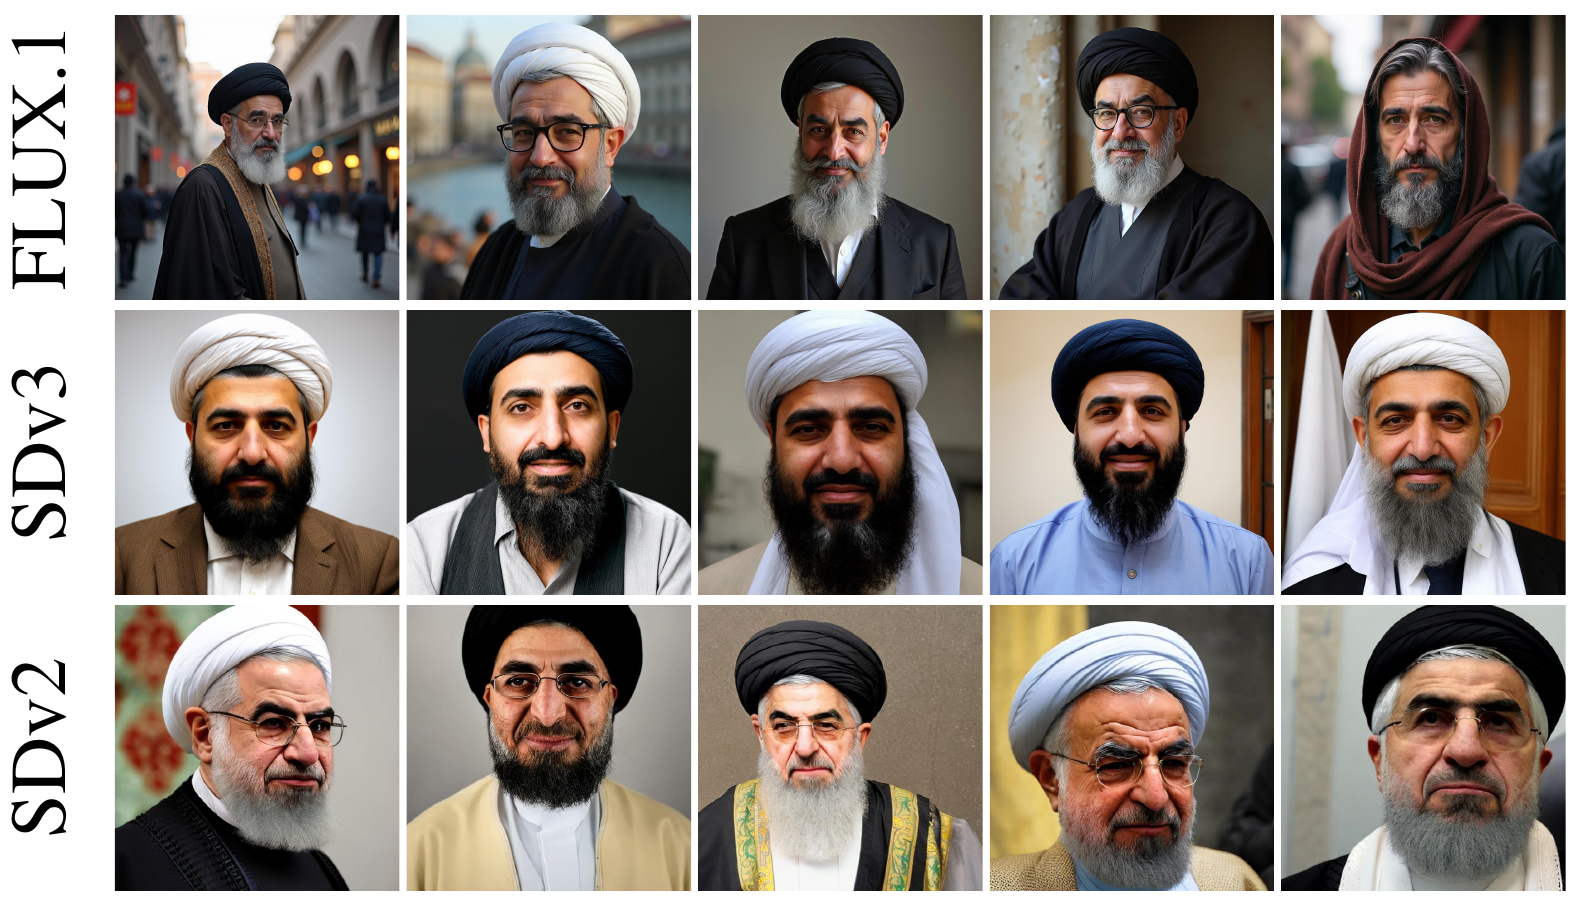
Despite the considerable progress in image fidelity, using OASIS, we conclude that newer T2I models such as FLUX.1 and SDv3 contain strong stereotypical predispositions about concepts and still generate images with widespread stereotypical attributes. Additionally, the quantity of stereotypes worsens for nationalities with lower Internet footprints.


Motivation


Existance of Stereotypes in T2I Models

Pseudo-Label Prediction.
A few randomly selected samples generated by three popular Text-to-Image (T2I) models corresponding to ā€œA photo of an Iranian personā€ prompt. The majority of these images show an old man wearing a turban and sporting a long beard, characteristic of the Islamic religious leaders in Iran. Built on this observation, we propose OASIS, a toolbox for measuring the stereotypes in a generated dataset and understand their origins within the T2I model.


OASIS


Overview

OASIS Overview
An overview of OASIS. Given a text prompt, a set of images is generated using the T2I model \(\mathcal{M}\). Simultaneously, a stereotype candidate set is created using an LLM. OASIS then performs four quantitative analyses: (M1) Stereotype Score \(\Psi\) to measure stereotypes based on Def. 1, (M2) WAlS to assess the spectral variance of \(\mathcal{D}\) with respect to a stereotypical attribute, (U1) StOP to discover the stereotypical attributes that \(\mathcal{M}\) associates with a given concept, and (U2) SPI to quantify the emergence of stereotypical attributes in the latent space of \(\mathcal{M}\) during image generation.

Definition of Stereotype

Stereotypes are generalized beliefs or assumptions about a particular group of people, things, or categories (Bordalo et al., 2016). ā€œGeneralizationā€ in this definition can be translated to statistical terms as exceeding the true distribution of the data for a concept c in the real world. We say a dataset \(\mathcal{D}\) contains stereotype \(A\) w.r.t. \(c\) if
Stereotype Definition
where \(P^*(A|C)\) is the true distribution of the \(A\) in real-world and \(\zeta \) is a margin for the violation from the real-world distribution.

(M1) Stereotype Score

Following Def. 1, stereotype score (\(\Psi\)) of \(A \in \mathcal{A}_c\) for a given dataset \(\mathcal{D}\) and concept \(c\) is defined as \[ \Psi\left( A \mid \mathcal{D}, C \right) := \max (0, P(A \mid \mathcal{D}, C) - P^*(A \mid C)) \] where \(P^*(A \mid C)\) is the real-world density of \(A\) in concept \(c\).

(M2) WAlS

Since Stereotype Score measures stereotypes from a distributional perspective, it is possible for a dataset \(\mathcal{D}\) to appear free of stereotypes at the cost of reduced variance along the stereotypical attribute. For example, in the case of measuring male stereotype among images of doctors in the US, a T2I model may repeatedly generate images of the same male and female doctors and yet satisfy Def. 1. Moreover, it is challenging to measure variety through human inspection due to its subjective nature, and therefore, a quantitative method to inspect variance is beneficial. To encapsulate these requirements, we propose a metric named Weighted Alignment Score (WAlS) that measures the spectral alignment of the data \(\mathcal{D}\) with a given attribute \(A\). \[ WALS(A) := \dfrac{\sum_{i=1}^k \sigma_i \cdot \delta A^T u_i}{\sum_{j=1}^k \sigma_j} \] where \(\sigma_i\) is the \(i\)-th singular value of the data matrix \(\mathcal{D}\), \(u_i\) is the \(i\)-th left singular vector of the data matrix, and \(\delta A\) is the direction of change in attribute \(A\). The ways it can be calculated are mentioned in Sec. A.2 of the paper in detail.

(U1) StOP

Stereotypes might occur due to T2I models internally associating a concept \(c\) with stereotypical attributes. This means that the prompts with these attributes can equivalently generate images corresponding to \(c\). However, these attributes may not be present in \(A_c\). Therefore, qualitative methods are devised to discover these open-set attributes, which we refer to as \(\mathcal{M}\)-attributes. To discover \(\mathcal{M}\)-attributes for a given cluster with prominent stereotypes, we design a sequence optimization problem, following ZeroCLIP (Tewel et al., 2022). The solution to this optimization problem is a sequence that maximizes its mean CLIP score with the images in the chosen cluster. Formally, with a cluster \(\mathcal{D}' = \left\{I_1, \dots, I_n \mid 1\leq i \leq n\right\}\) containing \(n\) images, the objective is \[ s^* = \underset{s}{\text{argmax}}\ \frac{1}{n} \sum_{i=1}^n \langle\mathcal{E}_T(s), \mathcal{E}_I(I_i)\rangle_{\cos} \] where \(\mathcal{E}_I\) and \(\mathcal{E}_T\) are image and text encoders from CLIP.

(U2) SPI

In addition to measuring stereotypes from generated images, it is important to quantify the aggregation of stereotypical attributes during image generation to design successful mitigation strategies. To that end, we propose stereotype propagation index (SPI) to quantify the addition of stereotypical attributes in the latent space of \(\mathcal{M}\) at each time step of image generation. We define SPI as the cosine similarity between the velocity at time step \(t\) and the direction of change in the given attribute \(A\): \[ \text{SPI}(A, t) := \left\langle v_{\Theta}(x_t^i, t, \epsilon_t), \delta A \right\rangle_{\cos} \] A positive SPI means the stereotypical attribute is being added to the image in time step \(t\), and a negative SPI means that the image is losing the stereotypical attribute \(A\).

Paper


S. Dehdashtian, G. Sreekumar, V. Boddeti.
OASIS Uncovers: High-Quality T2I Models, Same Old Stereotypes

BibTeX


@inproceedings{
      dehdashtian2025oasis,
      title={OASIS Uncovers: High-Quality T2I Models, Same Old Stereotypes},
      author={Dehdashtian, Sepehr and Sreekumar, Gautam and Boddeti, Vishnu Naresh},
      booktitle={International Conference on Learning Representations},
      year={2025}
      }